Algorithmic Injury Timelines Reshape Roster Planning Across Online Soccer Hockey and Baseball Leagues
Gisela Werner · Jul 11, 2026
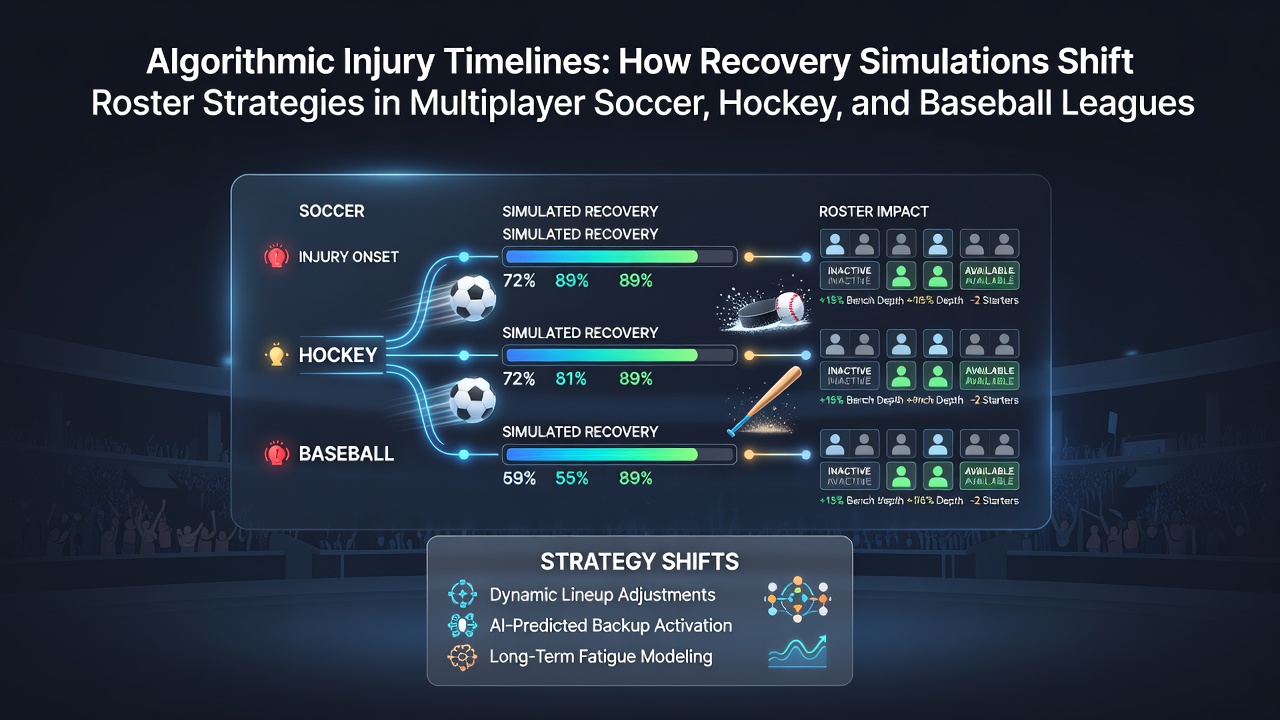
Algorithmic Injury Timelines Reshape Roster Planning Across Online Soccer Hockey and Baseball Leagues
Recovery simulation systems now calculate detailed injury timelines using player statistics injury severity models and historical performance data in multiplayer leagues for soccer hockey and baseball. These algorithms generate projected recovery windows that league participants use to adjust lineups bench depth and trade activity throughout extended seasons. Data from major simulation platforms shows that teams relying on these projections maintain higher win rates when managing multiple concurrent injuries compared with those using manual estimates alone.
Core Mechanics of Injury Timeline Algorithms
Modern recovery models integrate variables such as tissue damage categories fatigue accumulation rates and rehabilitation efficiency scores to produce timeline forecasts measured in simulated days or weeks. Soccer leagues track hamstring strains through kinematic data while hockey simulations emphasize concussion protocols and baseball systems focus on shoulder and elbow stress patterns. Observers note that these calculations update dynamically when players complete training modules or when medical staff input new diagnostics which allows roster decisions to reflect the latest available information rather than static assumptions.
League administrators report that injury timeline accuracy improved noticeably after major engine updates rolled out in early 2026. Teams that incorporate these forecasts into draft preparation and midseason roster moves reduce the frequency of forced emergency signings during peak injury periods. The systems also factor in position-specific demands so a starting pitcher recovery curve differs substantially from that of an outfielder or a defenseman.
Strategic Adjustments in Soccer Multiplayer Leagues
Soccer league participants apply recovery projections when setting weekly lineups and planning squad rotation during congested fixture schedules. Midfielders recovering from ankle injuries receive extended timelines that prompt managers to prioritize defensive reinforcements or youth academy call-ups. Data indicates that clubs using these simulations experience fewer instances of players returning prematurely and suffering setbacks.
Trade windows in these leagues now align closely with algorithm outputs because participants can anticipate when key players will regain full fitness. One documented case involved a European-style soccer league where a team traded for a striker whose projected return aligned with a championship playoff run resulting in improved goal-scoring consistency. Roster depth charts expand or contract based on overlapping injury clusters which forces managers to weigh short-term performance against long-term squad sustainability.
Hockey League Roster Dynamics Under Recovery Modeling
Hockey simulations incorporate body-checking impact data and ice-time fatigue metrics that feed directly into recovery forecasts for forwards and defensemen alike. League participants monitor projected absences for players on injured reserve lists and adjust power-play units or penalty-kill pairings accordingly. Research from Canadian simulation analysis groups reveals that teams maintaining at least two extra skaters per position when algorithms flag elevated injury risk maintain steadier standings positions through winter schedules.
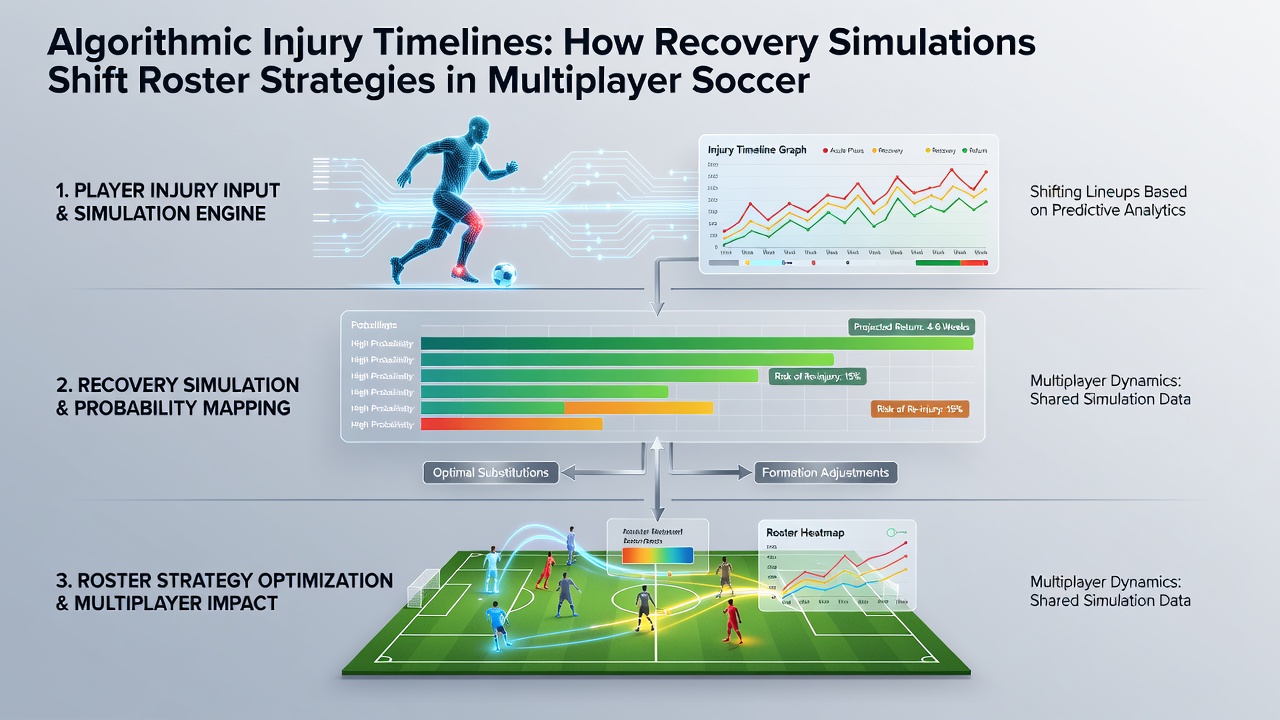
Playoff roster construction in hockey leagues relies heavily on these timelines because late-season injuries can eliminate depth players for extended stretches. Managers cross-reference algorithm outputs with cap space constraints to decide whether to recall prospects or pursue waiver claims. The models also differentiate between upper-body and lower-body injuries which alters how quickly skaters return to contact drills and game situations.
Baseball League Applications and Draft Impacts
Baseball simulations generate pitch-count and innings-pitched recovery curves that influence starting rotation construction and bullpen management across full 162-game schedules. Participants in online leagues review projected return dates for pitchers recovering from elbow inflammation or position players healing from oblique strains before finalizing trade deadlines. According to reports from the Entertainment Software Association updated simulation engines released in July 2026 refined these baseball-specific models which led to measurable shifts in how teams allocate draft capital toward injury-prone positions.
Minor league depth becomes a critical asset when algorithms project multiple overlapping absences for everyday players. Managers build contingency plans that account for both immediate replacements and long-term rehabilitation arcs which affects how prospects are promoted or optioned throughout the season. These projections also inform contract extension decisions because teams can forecast future availability windows with greater precision.
Cross-League Patterns and Platform Comparisons
Across soccer hockey and baseball multiplayer environments the most successful roster strategies combine algorithmic forecasts with real-time performance monitoring rather than relying on either element in isolation. Platforms that publish aggregate recovery statistics allow participants to benchmark their own injury management against league-wide trends. European research institutions studying digital sports analytics have documented that leagues with transparent timeline data exhibit reduced variance in team performance during injury-heavy months.
Season-long planning now incorporates Monte Carlo style simulations that test multiple injury scenarios against roster configurations. These exercises reveal optimal bench compositions and trade targets before actual injuries occur. Participants who integrate such planning tools report steadier results across regular seasons and postseason runs alike.
Conclusion
Algorithmic injury timelines have become central components of roster strategy in multiplayer soccer hockey and baseball leagues because they translate complex recovery variables into actionable projections. Teams that align their personnel decisions with these models demonstrate improved consistency in standings and playoff outcomes. Continued refinement of the underlying algorithms promises further integration between simulation accuracy and competitive roster management across all three sports.